How Much Energy Do Flap Barriers Consume? A Practical View

Flap barrier energy use is a cost that often hides in plain sight. Facility managers focus on purchase price and maintenance fees. Few consider the ongoing draw of each gate. Busy offices, transport hubs, and stadiums rely on flap barriers all day. Their motors spin. Their sensors stay active. Lights blink. Power consumption in access control systems can stack up. This article will break down flap barrier energy use in a simple, practical way. You will discover how knowing power usage helps with budgeting and sustainability planning. By the end, you will have clear metrics and actionable tips.
The Overlooked Cost of Energy in Access Control Systems
Energy use is often an afterthought in procurement. Buyers compare upfront costs. They weigh features like bi-directional flow or anti-tailgate sensors. Yet every flap barrier draws watts around the clock. Even in standby, circuitry and sensors sip power. Over weeks and months, that minor draw can become a significant line item. Operational cost is more than maintenance. It is the sum of every kilowatt-hour each unit logs. Ignoring this metric can undermine sustainability goals. It can also lead to budget overruns. Energy efficiency is more than a buzzword. It is a lens through which long-term value is viewed. Users crave reliable counts and smooth throughput. Yet they also want green credentials. Accurately tracking flap barrier energy use bridges both needs.
Why Energy Use Matters
Cost control drives every facility decision. Power consumption shapes utility bills. In high-traffic environments, hundreds of cycles per hour keep barriers active. Each cycle consumes current. Hallway lighting and networked sensors add baseline draw. Over a year, cumulative energy can rival maintenance budgets. Beyond dollars, environmental impact is real. Reducing power usage shrinks carbon footprints. It aligns with corporate sustainability pledges. Energy efficiency extends the life of components by preventing overheating. Systems that run cooler tend to fail less often. Understanding energy use is the first step toward smarter operations. Learn about best practices at the U.S. Department of Energy’s site on energy efficiency.
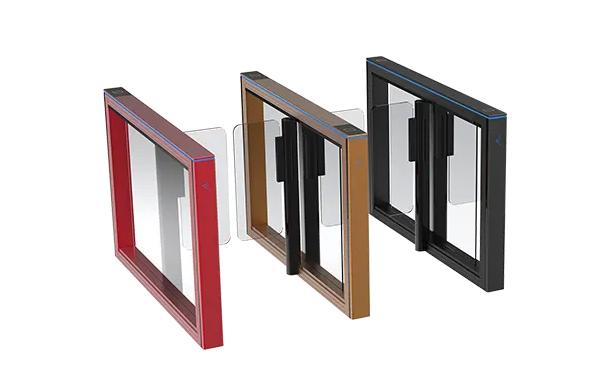
Flap Barrier Basics
A flap barrier is an access control gate. It consists of a motorized mechanism, flaps that retract, and sensors that detect users. That simple design delivers a fast, secure entry point. Yet each element has its own energy profile. Motors rated at 30–60 W drive the flaps open and closed. LED indicators and backlights draw an additional 5–10 W. Control boards and network modules sip 2–5 W in standby. Together, these components define the baseline power consumption. Different models boast varying specs. For precise figures, consult the manufacturer’s specifications. Advances in green tech have led to quieter, more efficient drives. Yet not all units adopt the latest innovations. When comparing models, look beyond price tags. Check their efficiency metrics and real-world performance data.
Average Daily and Monthly Flap Barrier Energy Consumption
Every facility is unique. Yet average figures offer a useful benchmark. A single flap barrier in a mid-sized office might stay in standby 22 hours per day. It might cycle 200 times during peak periods. Each cycle consumes roughly 0.02 kWh. The idle draw sits at 7 W. Over 24 hours, that adds up. Seasonal variations and security policies can shift numbers. Below is a typical scenario:
Measuring Daily Power Consumption
Measuring power consumption begins with simple math. Multiply the standby draw by active hours. Then add cycle usage. For example, 7 W standby over 24 h equals 0.168 kWh. Two hundred cycles at 0.02 kWh per cycle add 4 kWh. The total is roughly 4.168 kWh per day per barrier. Multiply that by utility rates to gauge daily cost. In many regions, rates hover around $0.12 per kWh. That yields about $0.50 in energy costs per barrier each day. Knowing these numbers informs operational cost planning. It also enables you to benchmark performance against new models. For detailed throughput and power data, refer to the performance specifications.
Typical Monthly Usage Scenarios
Extending daily figures to a month reveals larger trends. Multiply the 4.168 kWh daily figure by 30 days. The result is about 125 kWh per barrier per month. At $0.12 per kWh, that translates to $15 monthly per unit. In a building with 10 barriers, expect around $150 in power costs each month. Seasonal peaks may push usage higher. Holiday schedules can reduce idle time. Yet maintenance cycles and software updates can increase background draw. Tracking monthly power consumption allows you to spot anomalies. A sudden jump might signal a malfunctioning motor or a firmware bug. Early detection of unusual energy patterns can prevent downtime and additional costs.
Key Factors Affecting Flap Barrier Energy Use
Motor efficiency is a primary driver of flap barrier energy use. The type of motor impacts both peak power draw and long-term operational cost. Older systems often rely on brushed DC motors. These have simple designs but higher friction. They demand more current to overcome wear and heat. Modern flap barriers increasingly adopt brushless DC motors. Brushless designs reduce mechanical losses. They also allow tighter electronic control. That translates to smoother flap movements and lower overall power consumption. Facility managers looking to lower utility bills should compare efficiency metrics in product datasheets. Many manufacturers now highlight the use of brushless technology in their flap barrier innovation notes. Improved motor controllers can dynamically adjust current based on load. That avoids wasteful full-power draws when the barrier is unoccupied or lightly used. By selecting models with optimized motor topologies, energy efficiency gains of 20 percent or more are achievable. These gains add up quickly across multiple barriers and extended operating hours.
Standby mode draw is the silent contributor to power usage. Even when no one passes through, the control board and sensors remain active. Typical standby consumption ranges from five to ten watts per unit. Over months, that idle draw can rival the energy used during active operation. Innovations in smart standby mode have emerged to combat this hidden cost. Sensors can detect the absence of nearby users. The control system can then switch into a lower-power hibernation state. Flap barrier units equipped with this feature can cut idle power consumption by half. Integrating proximity or infrared sensors allows barriers to “wake up” milliseconds before use. The perceptible delay is negligible, yet the energy savings are substantial. Publications on green building and green tech trends continually emphasize smart standby features as key to reducing overall access control power consumption.
Operational Frequency and Throughput Impact
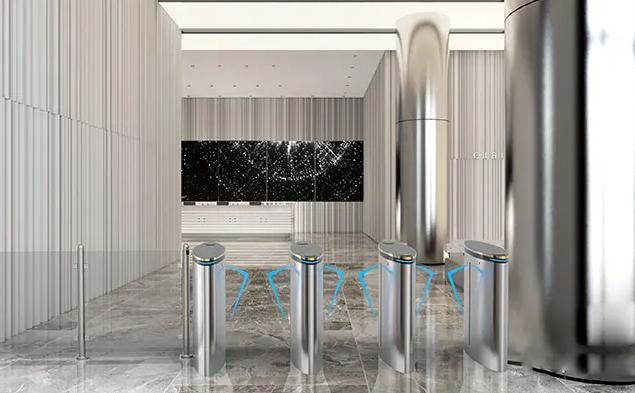
Operational frequency directly affects flap barrier energy use. In a high-traffic setting, barriers may cycle hundreds of times per hour. Each cycle requires energy to accelerate and decelerate the motor, overcome mechanical friction, and power LED indicators. High-traffic throughput sites such as transit stations or corporate headquarters can see active operation draw dominate the daily power consumption profile. In contrast, low-traffic facilities like small offices or labs may spend most of their time in standby mode. In the latter scenario, idle draw represents a greater share of cumulative power usage. Understanding the balance between active cycling and idle time is crucial for accurate power usage forecasting and operational cost modeling.
Peak versus off-peak periods create fluctuating power consumption patterns. During morning and evening rushes, barriers are in near-constant motion. That clustered activity spikes energy demand. Outside of those windows, barriers revert to standby draw. Utility metering systems that report time-of-use tariffs can further complicate cost calculations. Peak-hour rates can be significantly higher than off-peak rates in many markets. By analyzing barrier cycle data alongside tariff schedules, facility managers can estimate real-time operational costs more precisely. Some advanced control systems offer automated scheduling features. These systems can throttle non-essential background functions during peak-rate periods to reduce power usage spikes. They can also defer firmware updates or diagnostics until off-peak hours. Such strategies align with broader energy-efficiency goals and help avoid unexpected utility surcharges.
A nuanced understanding of operational frequency and throughput enables more effective budgeting. Facilities with multiple barriers can allocate energy costs to specific zones or departments based on usage patterns. Energy-monitoring software that integrates with barrier controllers provides dashboards showing active versus idle power draw. These insights highlight opportunities for further efficiency improvements.
Comparing Flap Barriers with Other Gate Types
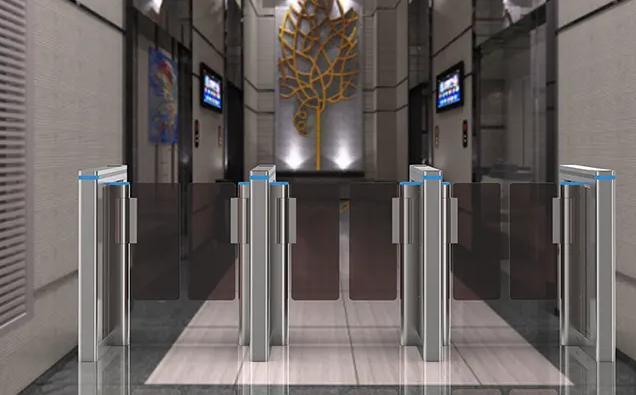
Flap barriers often compete with turnstiles, swing gates, and speed lanes in modern facilities. Turnstiles typically use a rotating mechanism that can draw 15 to 30 watts continuously, depending on design. In contrast, flap barriers—with their linear retractable wings—tend to concentrate energy use during the opening cycle, then revert to a lower standby draw. Swing gates, common in low-security areas, can consume upwards of 50 watts during motion and maintain a similar standby draw to flap barriers. Speed gates blend features of both, offering rapid throughput at the cost of higher peak power usage, often exceeding 70 watts per cycle. When evaluating power consumption across these gate types, flap barriers strike a balance. Their operational cost profile shows moderate active-cycle draw paired with relatively efficient idle performance. Facilities with moderate traffic flow benefit most from flap barriers’ blend of power usage and throughput. From an energy-saving perspective, flap barriers present a compelling middle ground: they outperform traditional turnstiles in efficiency metrics and avoid the high peak demands of speed lanes. For procurement teams, comparing the full power consumption curve—active versus idle—highlights the true advantage of flap barrier energy use in day-to-day operations.
Strategies to Reduce Flap Barrier Energy Use
Reducing flap barrier energy use begins with selecting units designed for efficiency. Upgrading to motors with advanced electronic drives can lower cycle draw by up to 25 percent. These energy-saving motors adjust current in real time, matching torque to user weight and speed requirements. Retrofitting existing barriers with smart standby controllers further cuts power consumption during idle periods. Such controllers employ infrared or ultrasonic sensors to detect absence of traffic and switch the gate into a low-power hibernation state. Power usage drops to less than 3 watts in this mode. Beyond hardware, operational policies influence energy use. Configuring gates to default to night-mode during off hours reduces unwanted background activity. Simple software tweaks—like delaying non-critical firmware updates to daylight hours—smooth power demand peaks. Regular maintenance, including lubrication of mechanical parts and firmware updates, preserves motor efficiency over the long term. By combining hardware upgrades with procedural changes, facility managers can significantly reduce both energy consumption and operational cost.
Environmental Impact of Energy-Efficient Barrier Systems
Every kilowatt-hour saved translates directly into lower greenhouse gas emissions. Flap barriers with optimized motors and smart standby modes can reduce annual energy use by hundreds of kilowatt-hours per gate. Across a campus of 20 barriers, these savings can amount to several megawatt-hours and avoid over a ton of CO₂ emissions each year.
Energy-efficient access control aligns with broader corporate sustainability goals. Reporting reduced power consumption strengthens ESG metrics and satisfies stakeholder expectations. Environmental impact also manifests through reduced heat generation. Cooler-running motors place less strain on air-conditioning systems, creating secondary savings in HVAC power consumption.
Facilities that pursue flap barrier energy use optimization often see downstream benefits: lower maintenance-related waste, decreased demand on backup generators, and improved occupant comfort. Integrating efficient barriers into green building certifications—from LEED to BREEAM—further enhances an organization’s sustainability profile. By quantifying both direct and indirect energy savings, sustainability officers can build a comprehensive case for further investment in energy-saving technologies.
Real-World Cost Examples for Facility Managers
Consider a mid-size office building with eight flap barriers. Under typical usage, each barrier consumes around 125 kWh per month. At a utility rate of $0.15 per kWh, the total energy cost is $150 per barrier each month, or $1,200 for all eight. Upgrading to high-efficiency motors and smart standby can cut energy use by 30 percent. That reduces monthly consumption to about 87 kWh per barrier and lowers the monthly bill to roughly $104 per barrier.
Across eight units, the facility saves nearly $368 each month. Over a year, that’s more than $4,400 in energy-cost reductions. For a large transit hub with 50 barriers, similar efficiency gains translate to over $27,000 in annual savings. Beyond dollar figures, monitoring systems can identify underperforming units.
A barrier drawing an extra 10 watts in standby adds nearly 73 kWh annually—costing an extra $11 per gate. Proactive maintenance or component replacement resolves inefficiencies quickly. Presenting these real-world examples helps procurement teams and CFOs visualize the direct financial impact of flap barrier energy use improvements.
Future Innovations in Flap Barrier Energy Efficiency
The next generation of flap barriers will leverage IoT and AI to drive further efficiency gains. Embedded sensors will continuously monitor motor current, temperature, and usage patterns. AI algorithms can predict peak traffic flows and adjust gate readiness—minimizing idle power draw while ensuring instant response.
Machine learning models will refine efficiency metrics over time, tuning motor drive profiles for specific user behaviors. Battery-assisted operation during peak hours could shave demand charges by drawing from stored energy rather than the grid. Integration with building management systems will allow coordinated control of lighting, HVAC, and access gates, optimizing overall facility power consumption in real time.
Emerging materials, such as low-friction composites, promise mechanical losses below those of traditional metal bearings. Combined with next-gen semiconductor drives, these advances could reduce active-cycle energy use by over 40 percent. As green tech evolves, flap barrier energy use is set to become an even smaller fraction of total operational cost, reinforcing their role as both secure and sustainable access solutions.
Implementing Energy Monitoring for Flap Barriers
Energy monitoring transforms flap barrier energy use from a guess into actionable data. Sensors and meters can record real-time power consumption. These devices attach directly to the barrier’s power lines or integrate via the control board. Data flows to a central dashboard. There, facility managers can visualize energy demand by hour, day, or week. Advanced platforms layer in environmental data such as temperature or occupancy levels. This context highlights correlations. For example, higher ambient heat can increase motor current draw. With these insights, team members can pinpoint inefficiencies. They can also verify the impact of hardware upgrades or software tweaks.
Software solutions vary in complexity. Some offer basic readouts of kilowatt-hours used per barrier. Others provide predictive analytics and automated alerts. A spike in idle draw might trigger maintenance requests. A sudden rise in cycle energy could indicate mechanical wear. Cloud-based systems support multi-site rollups. That lets regional managers compare energy use across offices or campuses. Local installations benefit from edge-compute options. In this model, data is processed on-site for immediate control actions, reducing latency and network costs.
Selecting the right tools depends on scale and goals. Small facilities may deploy a single energy monitor per barrier. Large enterprises often integrate monitoring into the building management system (BMS). This provides a unified view of lighting, HVAC, and access control. Seamless BMS integration enables coordinated energy-saving strategies. For instance, if barrier activity drops at night, lighting and climate systems can follow suit. Data security is also critical. Energy-monitoring platforms must encrypt data in transit and at rest. They must support role-based access for IT, facilities, and sustainability teams.
ROI and Payback Period for Energy-Efficient Upgrades
Calculating return on investment for energy-efficient upgrades starts with baseline energy use. Using energy-monitoring data, facilities establish current consumption profiles. For example, a barrier consuming 125 kWh per month at $0.15 per kWh costs $18.75 monthly. Upgrading to an energy-saving motor and smart standby mode might reduce consumption by 40 percent, dropping monthly usage to 75 kWh. The new cost becomes $11.25 per barrier per month. The monthly saving is $7.50 per barrier. If the hardware upgrade costs $500 per barrier, the payback period is approximately 67 months, or just over five and a half years.
These calculations change with scale. In a 20-barrier deployment, total upgrade cost is $10,000. Monthly savings climb to $150. The payback period shrinks to around 67 months, the same per-unit figure, but the aggregate savings are more impactful for budget holders. For large transit facilities with higher utility rates or demand charges, the financial case strengthens. Demand charges based on peak-kW draw can be mitigated by reducing simultaneous barrier activations. Battery-assisted microgrids or staggered firmware updates can shave these peaks further.
Non-monetary returns also matter. Energy-efficient barriers improve ESG scores. They reduce carbon emissions, supporting corporate sustainability reports. They often qualify for utility rebates or tax incentives for energy-saving equipment. These incentives can shorten payback periods by up to a year. Including potential rebates in the ROI model gives a more comprehensive financial picture.
Budgeting for upgrades requires collaboration. Procurement teams must specify energy metrics in RFPs. They need clear performance thresholds for peak and standby power. Facilities teams should provide usage data to vendors. Finance teams can then model depreciation, rebates, and tax impacts. With a transparent methodology, stakeholders gain confidence in the investment. Energy-efficient flap barrier upgrades become not just a cost, but a strategic initiative with measurable returns.
Best Practices for Procurement Teams
Procurement teams play a pivotal role in optimizing flap barrier energy use. The RFP process should include specific energy efficiency criteria. Request detailed datasheets that list active-cycle power consumption and standby draw in watts. Require vendors to provide real-world tests or case studies. Internal performance benchmarks can be supplemented by third-party certifications.
When evaluating proposals, score suppliers on both upfront cost and lifecycle energy cost. Develop a weighted scoring model that balances purchase price, installation cost, and projected energy savings. Include questions about motor technology—brushed versus brushless—and the availability of smart standby features. Insist on transparency regarding firmware updates and remote management capabilities.
Site visits and pilot programs are invaluable. Testing one or two barriers in the actual operating environment yields data on power usage under real traffic conditions. Use energy monitors to capture this data. Compare pilot results against vendor claims. Adjust your procurement specifications based on findings.
Finally, negotiate service-level agreements that cover energy performance. Include clauses that set maximum allowable standby draw and maximum per-cycle energy use. Incorporate penalties or credits tied to actual energy data. This aligns vendor incentives with your operational cost goals. By embedding energy efficiency into procurement processes, teams ensure that flap barrier energy use remains a managed variable rather than an unpredictable expense.
Tips for Sustainability Officers
Sustainability officers should integrate access control energy use into broader environmental programs. Start by setting targets for energy reduction specifically tied to flap barriers. Use baseline data from energy monitoring to define goals. Align these targets with existing corporate sustainability objectives or external frameworks such as Science Based Targets.
Communicate the impact of barrier upgrades to stakeholders. Create quarterly or annual reports showing kilowatt-hours saved and CO₂ emissions avoided. Illustrate secondary benefits such as reduced HVAC load due to cooler-running motors. Highlight cost savings alongside environmental gains to appeal to both finance and operations teams.
Collaborate with IT to explore IoT and AI-driven efficiency metrics. Dashboard visualizations can feed into company-wide sustainability portals. Celebrate milestones internally through newsletters or town halls. Use these success stories to build momentum for further initiatives.
Finally, evaluate potential green financing options. Some institutions offer low-interest loans for energy-efficient infrastructure. Rebates from utilities for demand management or efficiency upgrades can offset costs. By combining operational improvements with financial incentives, sustainability officers can accelerate payback periods and deliver measurable environmental performance.
Conclusion
Flap barrier energy use is more than a technical footnote. It represents a tangible component of operational cost and environmental impact. By understanding daily and monthly consumption, facility managers can plan budgets accurately. By factoring in motor efficiency, standby draw, and throughput, stakeholders make informed procurement and upgrade decisions. Energy monitoring and predictive analytics turn hidden power draws into visible metrics. Upgrades to brushless motors and smart standby modes yield significant savings. Proper RFP specifications and pilot programs validate vendor claims. Sustainability officers can then translate kilowatt-hour reductions into carbon emissions avoided, strengthening ESG profiles.
Share on Social: